1、背景
最近参与开发的java项目存在比较严重的性能问题,前端访问经常需要很长时间才能获得回包,为了定位系统中的热点区域,需要对系统进行profile,然后针对性的优化。所谓工欲善其事必先利其器,一个好的profile工具需要具备:1、能以图形化形式统计各种性能指标的详细信息,包括内存、CPU、函数调用耗时等信息。2、对原应用影响小。3、能方便进行远程profile。基于以上几点,最终我选择了JProfiler,这个工具的功能非常强大,能满足profile的各种需求。
2、JProfiler介绍
JProfiler分为GUI和Agent两部分,其中GUI部分负责接收用户指令及展示,Agent部分负责采集JVM信息,工作流程如下所示:
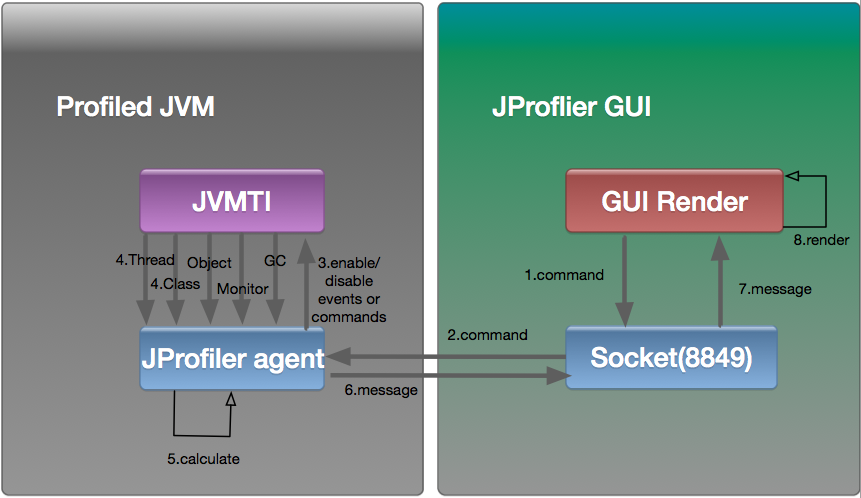
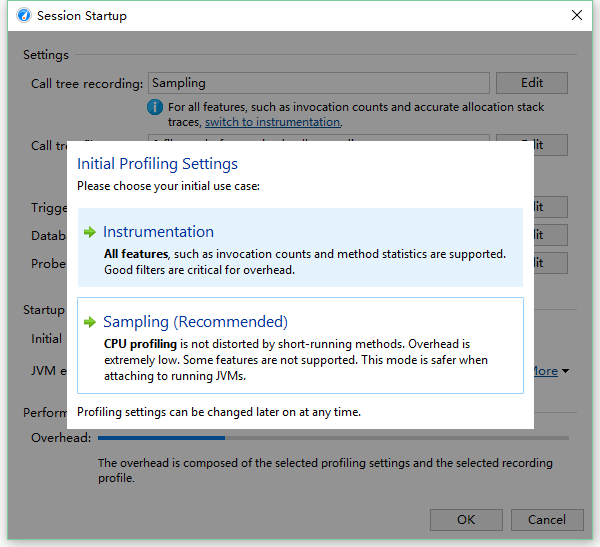
JProfiler数据采集方式分为:Instrumentation、Sampling。Instrumentation是通过Instrument技术在待分析的class中插入监控字节码,能做复杂的分析,如函数调用次数等。Sampling是定时采集每个线程栈中的调用链,对原应用影响最小。
3、JProfile使用
以下通过profile一个远程服务进行举例说明。
3.1 安装JProfiler
需要在客户端上安装JProfiler GUI(如:jprofiler_windows-x64_11_0_1.exe),在服务器上安装JProfiler(如:jprofiler_linux_11_0_1.tar.gz)。
3.2 启动远程服务
创建文件App.java:
public class App {
    public static void main(String[] args) {
        App app = new App();
        while(true) {
            app.doSomething();
        }
    }
    public void doSomething() {
        try {
            System.out.println("Hello World");
            Thread.sleep(1000);
        } catch(InterruptedException e) {
            e.printStackTrace();
        }
    }
}
编译:
javac App.java
执行方式:
java -agentpath:/home/jemuel/jprofiler11.0.1/bin/linux-x64/libjprofilerti.so=port=8849 App
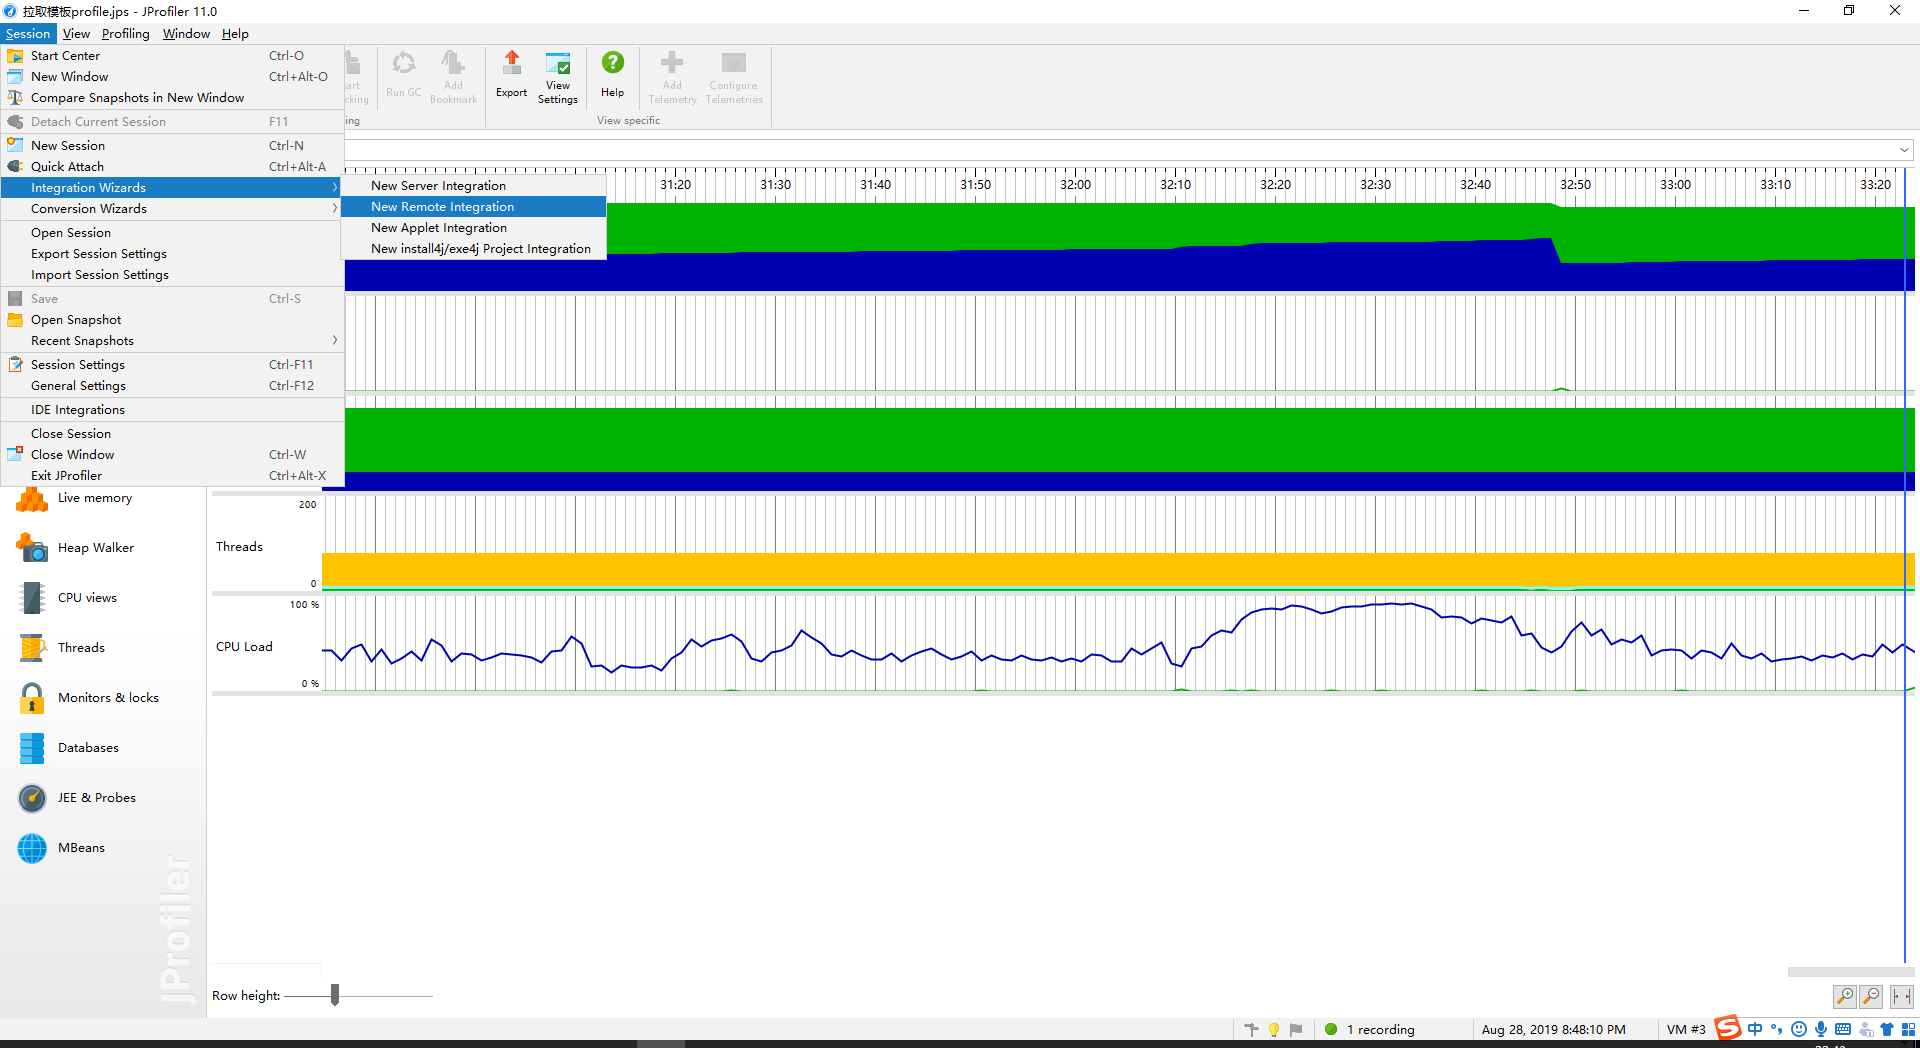
3.3 客户端GUI配置步骤
创建远程服务监控
远程机器OS
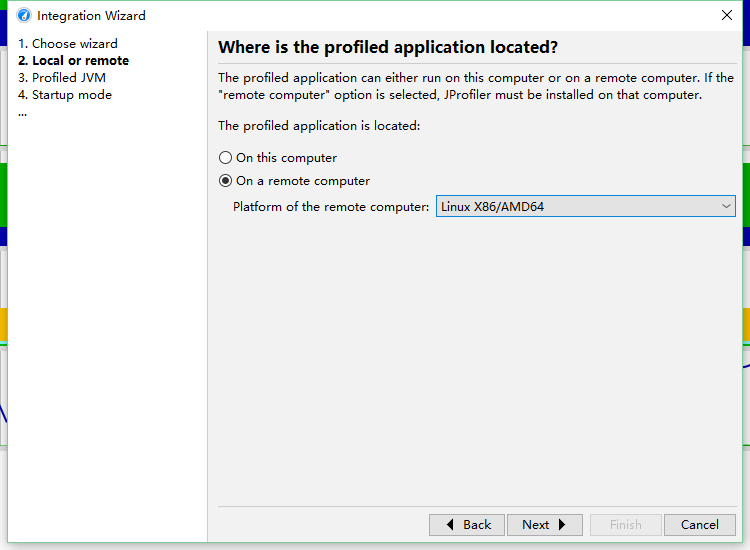
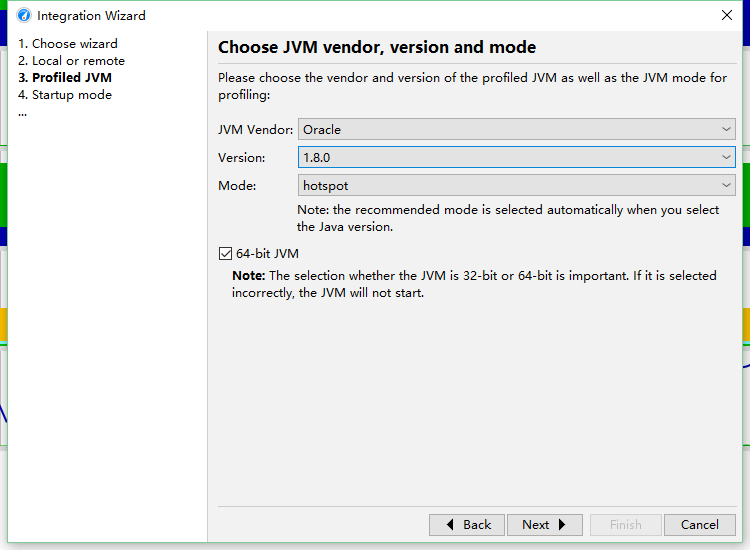
远程机器JDK版本

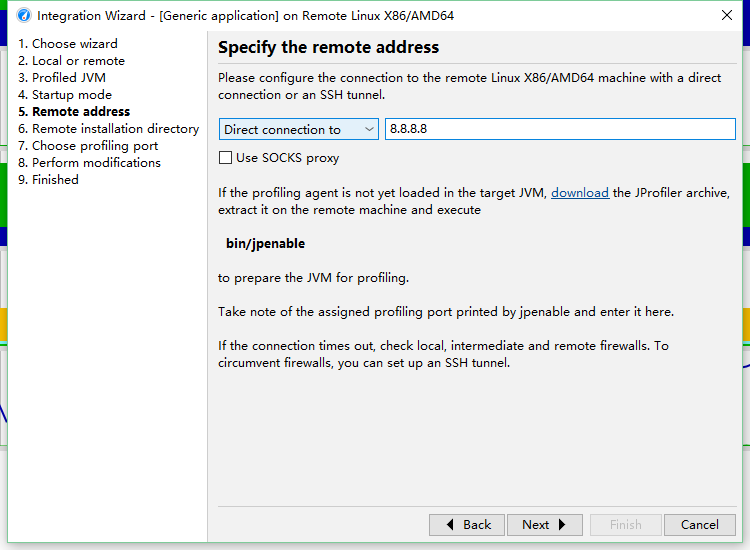
远程机器地址
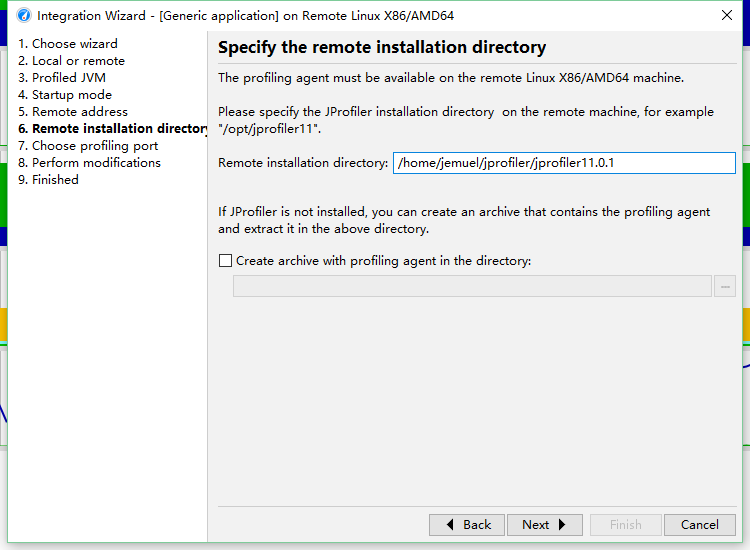
远程机器上JProfiler安装目录
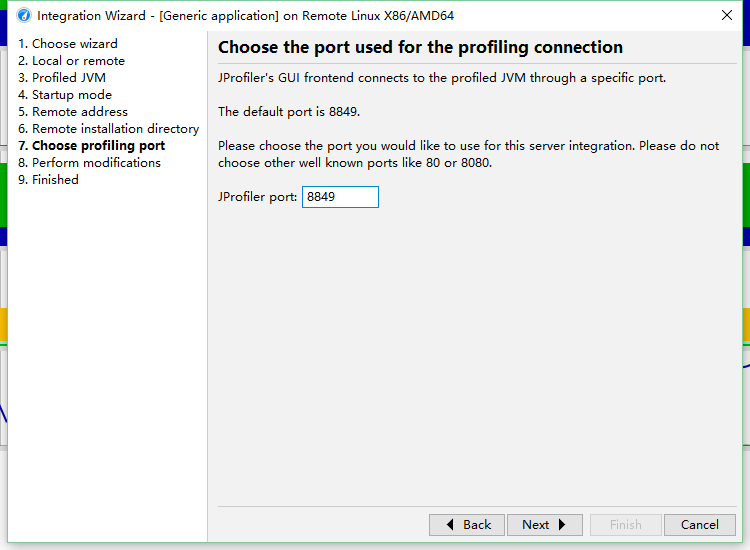
远程机器JProfiler监听端口
配置采样模式
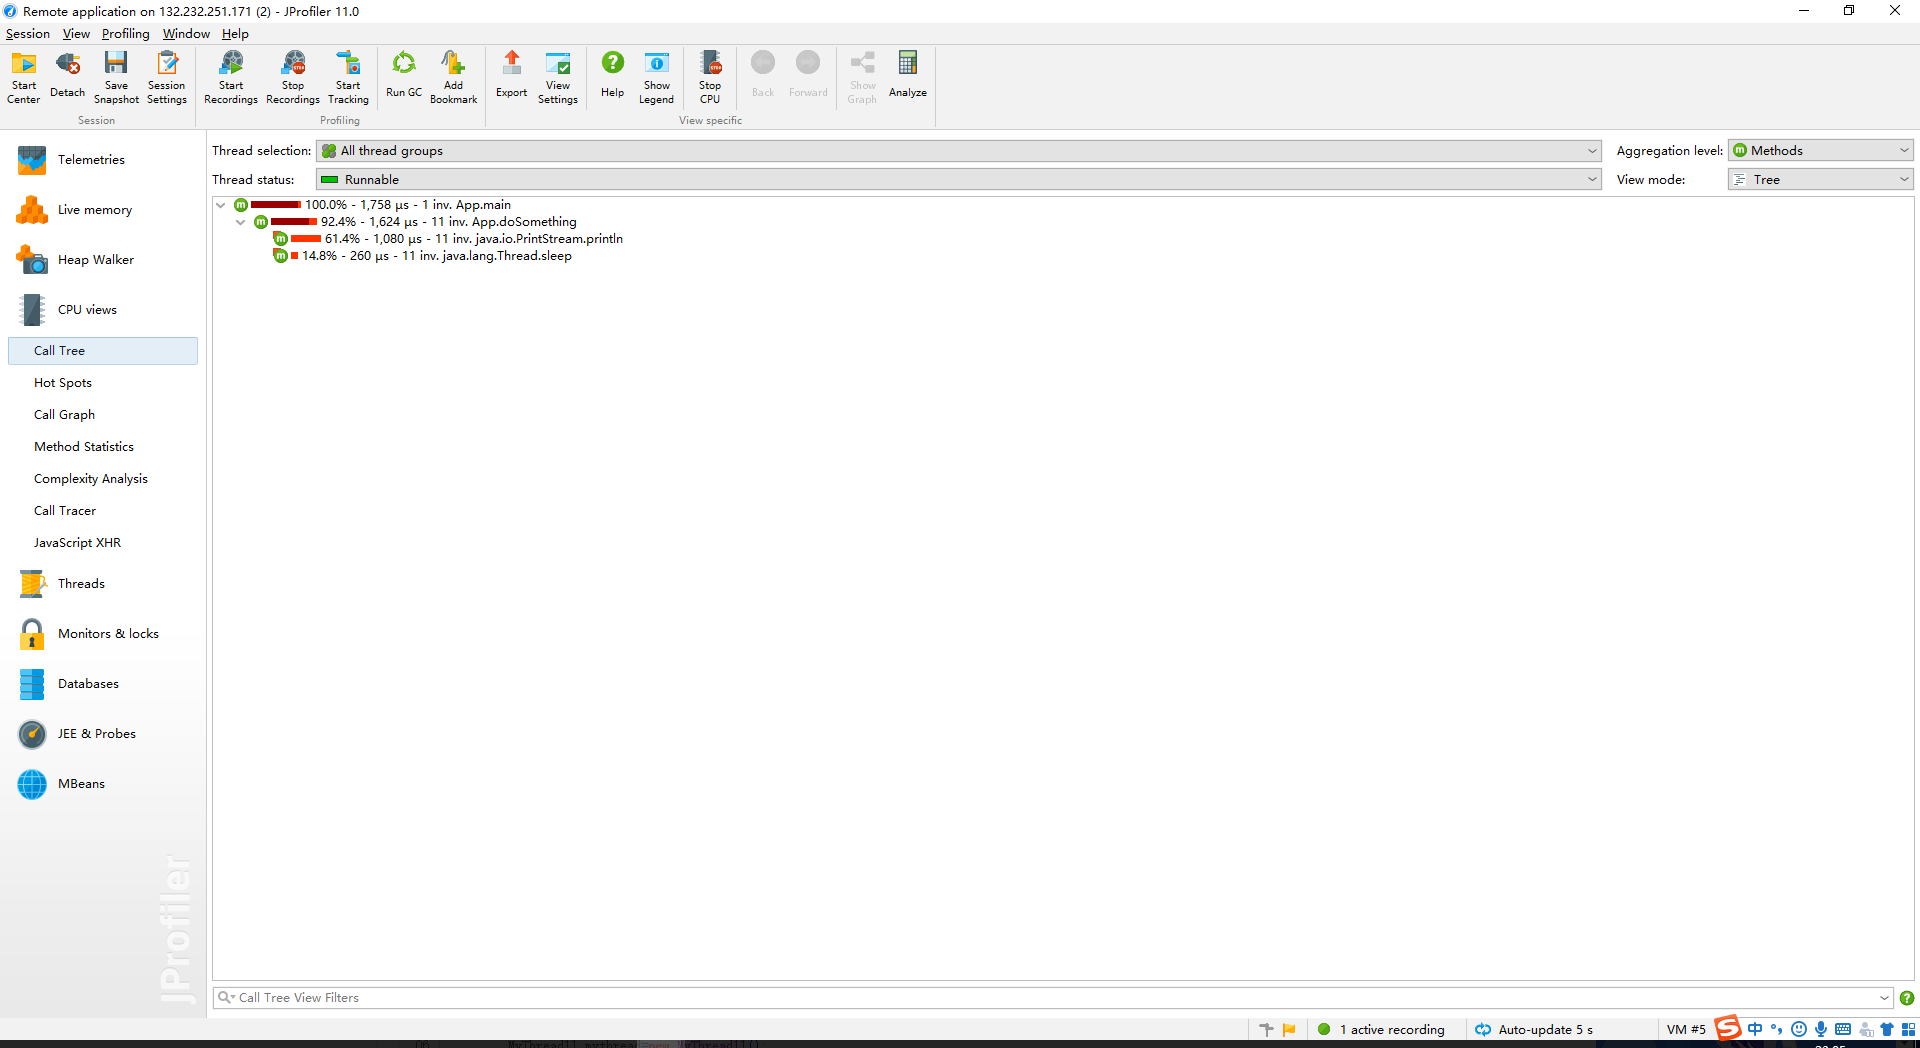
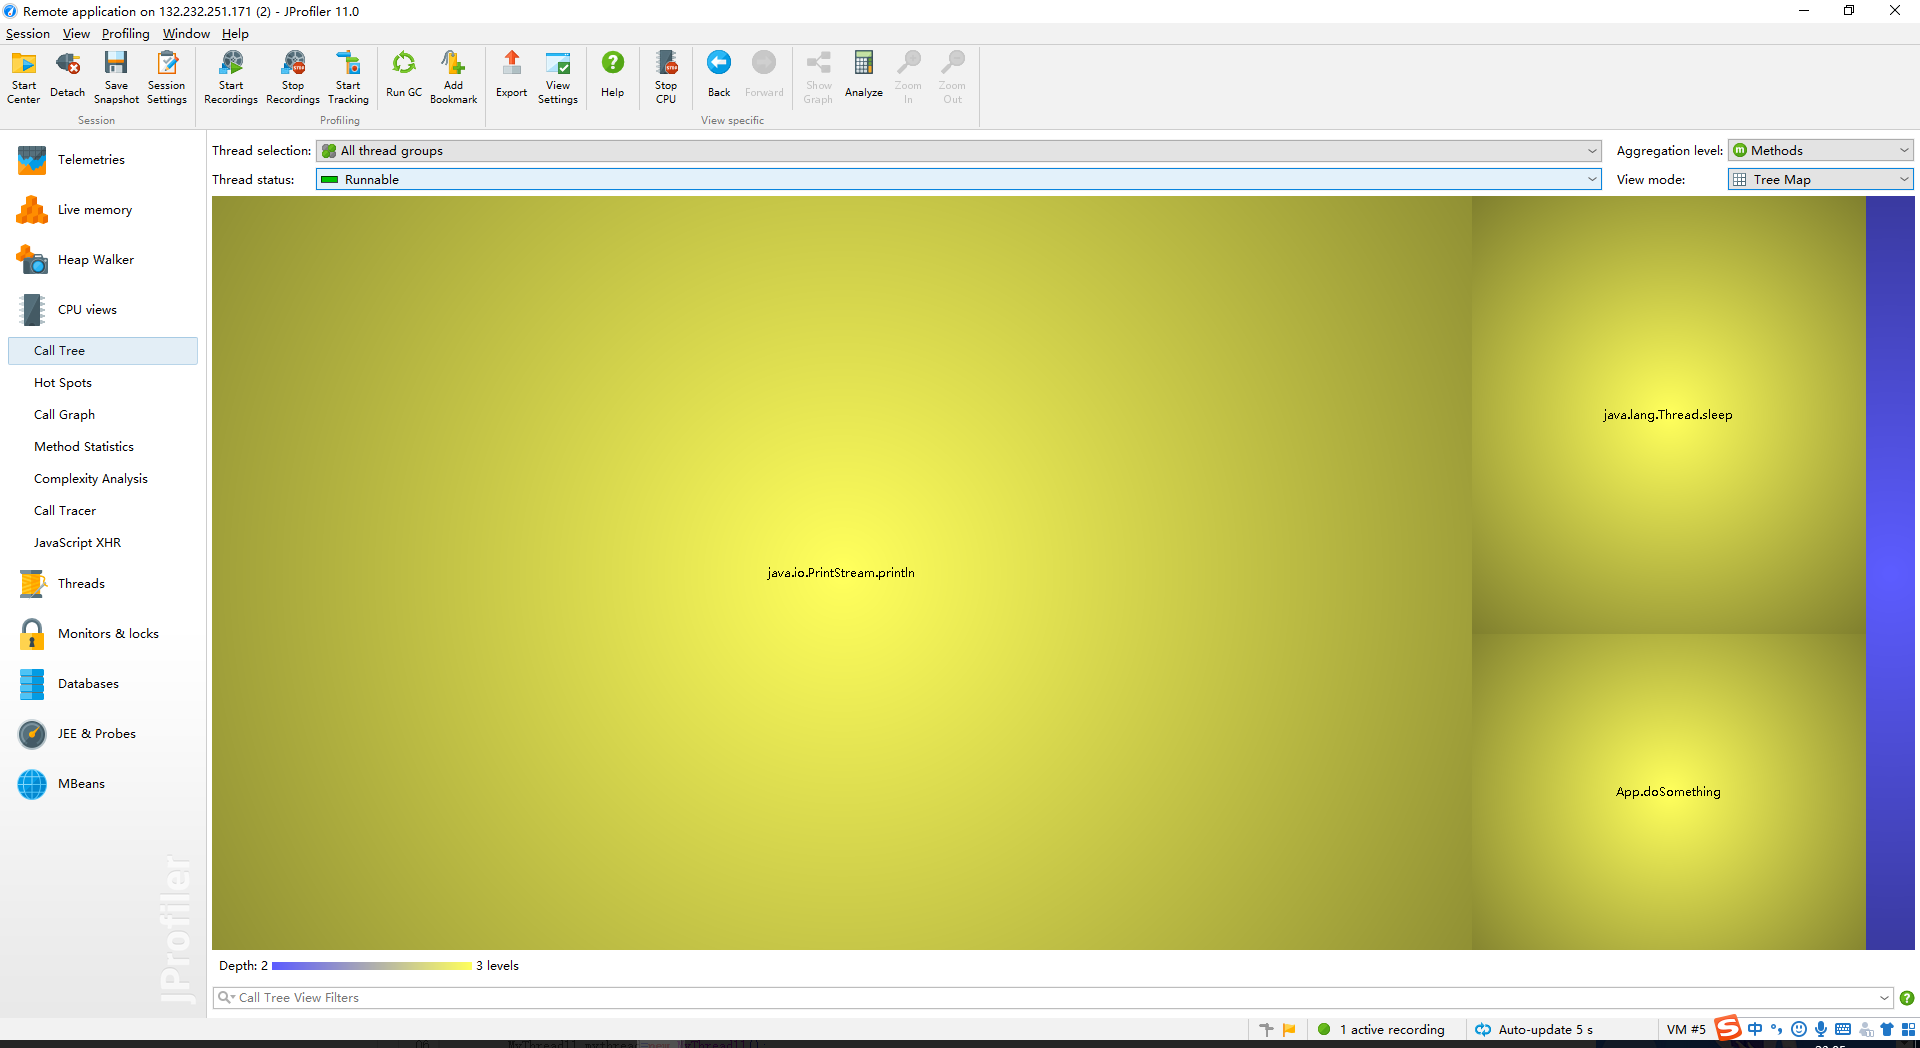
3.4 查看函数调用情况(其他信息可自行研究)

文章评论